Categories
Visualization

Visualization

My website, “The Blood of Patriots and Tyrants,” was created using WordPress. The website itself features four pages: “Home,” “U.S. History of Reactionary Politics,” “U.S. Veteran Activity at the U.S. Capitol,” and “About.” I have implemented two digital tools thus far: TimelineJS and ArcGIS. The timeline I created conceptualizes historical events which involve veteran usage of reactionary politics in U.S. History. Using ArcGIS, I created a map visualization which plots where the 60 veterans who were charged by the government for their role in rioting at the Capitol building were from. Below is the link to my website as it stands:

The Blood of Patriots and Tyrants (gettysburg.edu)

This post was created by Ben Johnson, Gettysburg College Class of 2022 and member of the DSSF Summer Cohort of 2021.
Categories
Visualization

Visualization

In my project, I wanted to centrally focus on the narratives surrounding Lilith from the beginning of civilization up to the 20th century in order to visualize how they have changed in their characterization of this enigma. Therefore, I have used TimelineJS in order to create a timeline that shows changes in Lilith’s story as times have changed.

Here is a link to my timeline. I need to do a bit of light editing, especially on the credits. I’d be glad to get everyone’s view on this!

https://cdn.knightlab.com/libs/timeline3/latest/embed/index.html?source=15FgHpGsOUn46JbZFgi5VpElTpzKWwcHxyr1-sPGCGho&font=Default&lang=en&initial_zoom=2&height=650

Created by Shukirti Khadka, Gettysburg College Class of 2024 and part of the DSSF 2021 Cohort.

Categories
Visualization

Visualization

While looking into sitcoms throughout the 20th Century, I decided to make a timeline exploring relevant/ notable series throughout the history of comedy in television. There are likely to be some changes to this timeline, as there is room to add more series/ plenty more sitcoms that were historically and culturally relevant, but my goal was to include a series from every decade or so. The link below should take you to the timeline made with TimelineJS.

https://cdn.knightlab.com/libs/timeline3/latest/embed/index.html?source=1k6B2Q_2KjHNXyhpSwyRmaINfc_FMFkye2_ddMnouw_0&font=Default&lang=en&initial_zoom=2&height=650

Created by Nicole Parisi, Gettysburg College Class of 2023 and member of the DSSF 2021 Summer Cohort.

Categories
Visualization

Visualization

Hello again! Carlee here.

For this post, I want to share something slightly unique to my project that we have not really discussed in any of our workshops – a data visualization made with Canva.

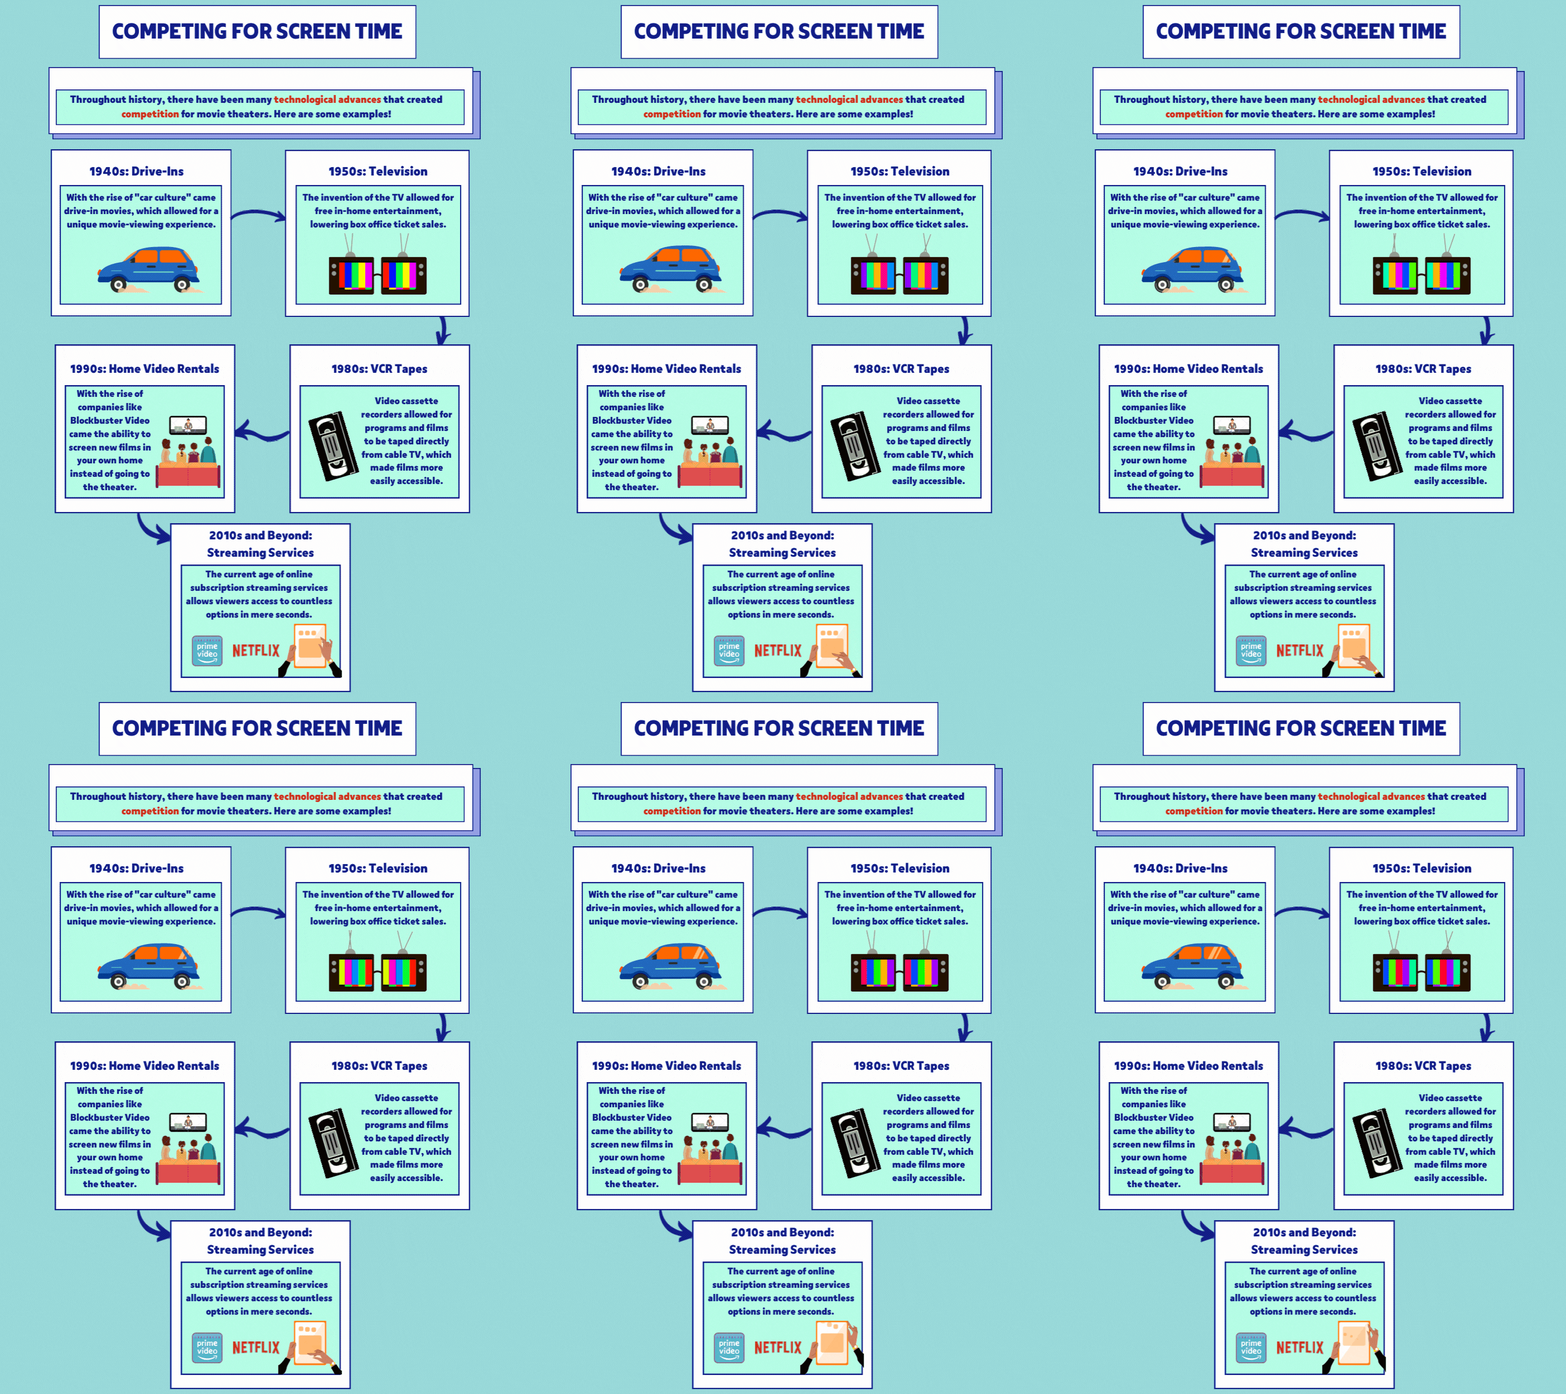
In my meetings with my librarian buddy, Kevin, I mentioned that I was interested in finding an accessible and vibrant way to display the different technological advances that have cropped up as competition against movie theaters throughout the years.

Being a bit, ahem, fed up with TimelineJS after using it for our microproject and another part of my own project, I wanted something new, so Kevin and I decided on Canva. Here’s what came out of that!

Made with Canva

I’m excited to hear your feedback and comments!

Cheers,
Carlee

Categories
Visualization

Visualization – Theary Heang

I create my project in Arc GIS Storymap. So far, I have created 2 stories in my website, and please see the link to it below.

This is the link to one of my story page that called “Time Machine: Cambodian Refugees in the U.S.” with subtitle of “A look at Major Events regarding the Cambodian Refugee’s early resettlement in the U.S.”

https://arcg.is/1mniL5

Below is my other story page titled “Indochinese Refugee Camps in the U.S. in 1975” with a subtitle of “Explore the American Resettlement Program for Indochinese refugees (Cambodian, Vietnamese and Laos) in 1975 through StoryMap”

https://arcg.is/0CzmfW

These are the visualization of 2 pages from my website. I hope this helps introduce a little bit of my project.

css.php