ZeeMaps is a mapping tool that has multiple marking tools and annotative abilities. ZeeMaps is different from other mapping tools in its simplicity, it is literally just a map that you can add annotations to or connect markers. Other mapping tools like StoryMap JS or ArcGIS try to present their maps like stories, which is great for presentation but the presentation takes away from the map itself in some regards.
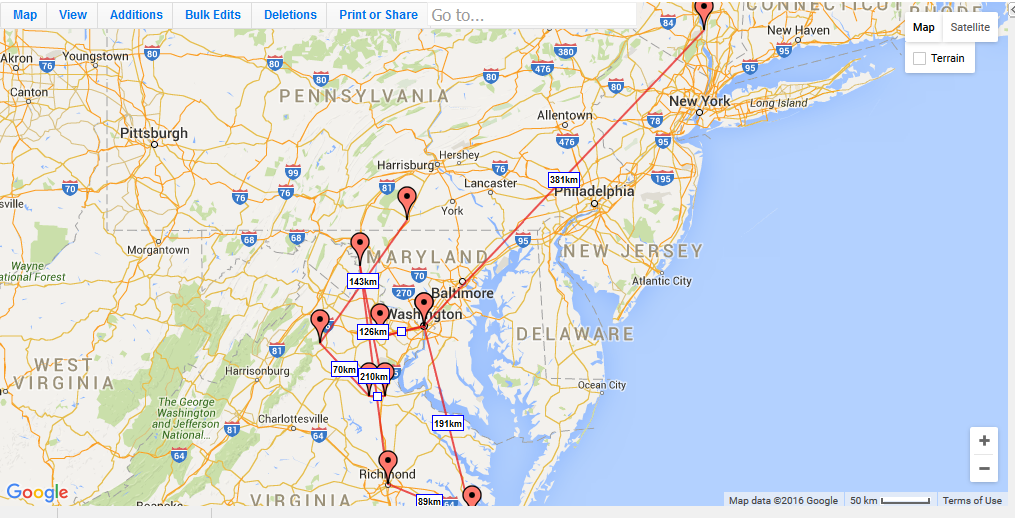
ZeeMaps would help me in regard with the visualization of the journeys of all the cadets through the war and would show their connections since many of them were at the same battles or arsenals. Using the Connect tool, you can connect multiple locations which can show the individual journeys of cadets.
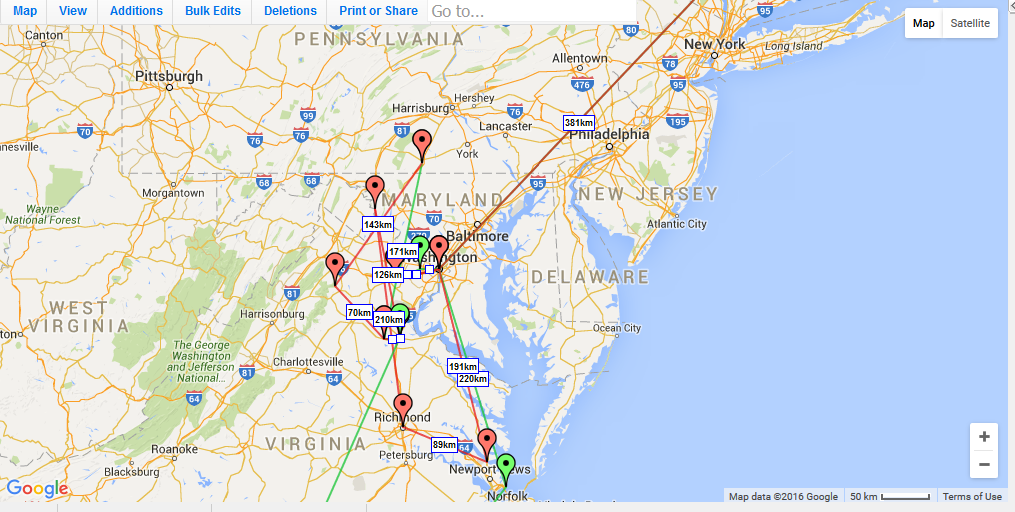
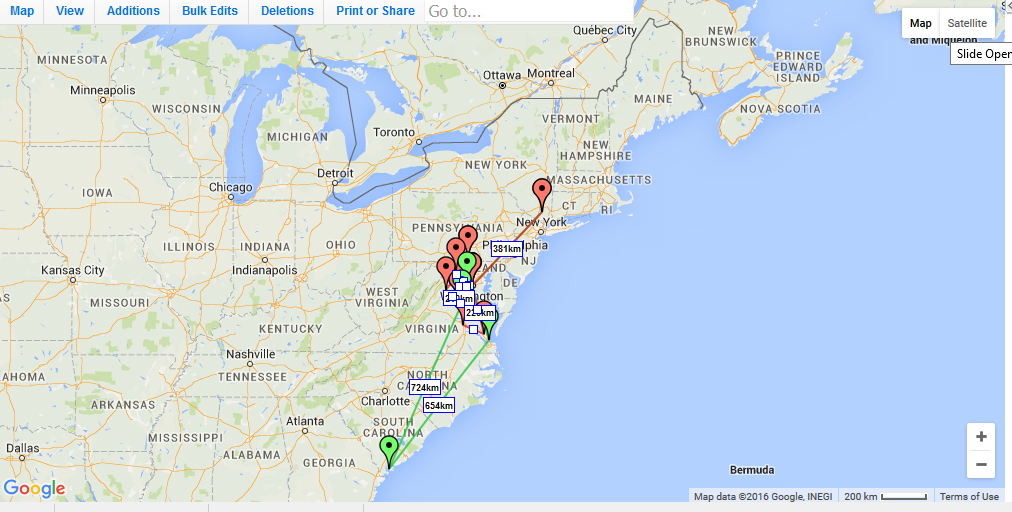
However, what I at the current moment cannot figure out is how to turn off the distance calculator for the connections because it makes it quite messy and you cannot see the connections or markers as well.
What makes ZeeMaps super helpful to me is that it has the ability for different colored markers and connections that can easily differentiate the cadets.
ZeeMaps is free except a couple of features that require payment to use. The features that you have to pay to use are just bulk features so really, you get the full experience of ZeeMaps for free.
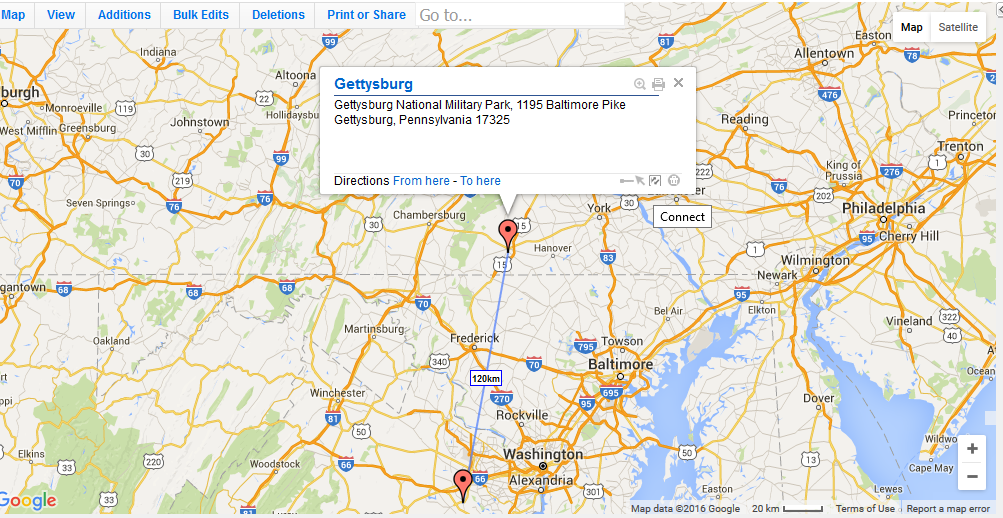
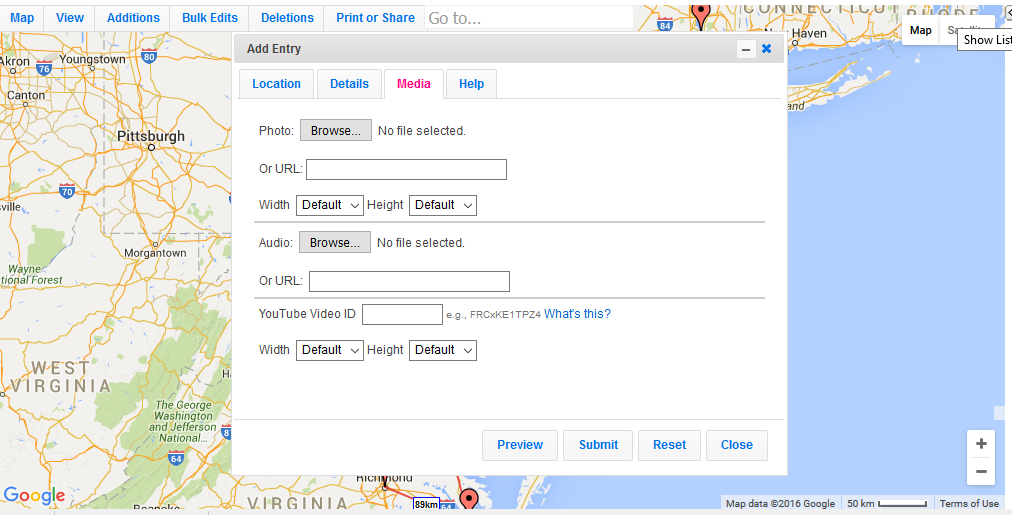
ZeeMaps only requires location to put down a marker, but there are many features that you can add to the markers such as: title, annotations, media, audio, youtube videos, pictures, etc.
ZeeMaps is very easy to use, no expert needed. Every feature on ZeeMaps can be figured out and explained easily. Even if you already put down a marker, it can be easily edited, removed, what have you. There is no html, CSS, JavaScript experience needed to work ZeeMaps unless you wanted to edit the code itself.
I could very well use this tool in my project. I have shifted my thinking from doing a huge timeline/map that encompassed each cadet into making a timeline for each cadet individually and a big map for a visual reference, showing their journeys and the connections in their journeys. While ZeeMaps does not have the neat presentation of other mapping apps like StoryMap JS and ArcGIS, it would serve the purpose of showing the cadets’ journeys. But it does have very very simple presentation which I think might clash with the aesthetic of my project, but I could see if it would look better while embedded into a website. Another downside to ZeeMaps is that there are only 31 markers, I need at least 38 for all of my cadets. However, with all 38 cadets, the map will get messy and confusing and I am not really sure how to handle that at this current moment, but I am sure that I will figure it out with more experimentation and work on ZeeMaps and other mapping tools.
Good analysis. CartoDB (http://cartodb.com) may be able to do a lot of this, but it’s a bit more complex to use; it tends to be used more for data visualization, but since you have a lot of data points it may be something worth looking into.